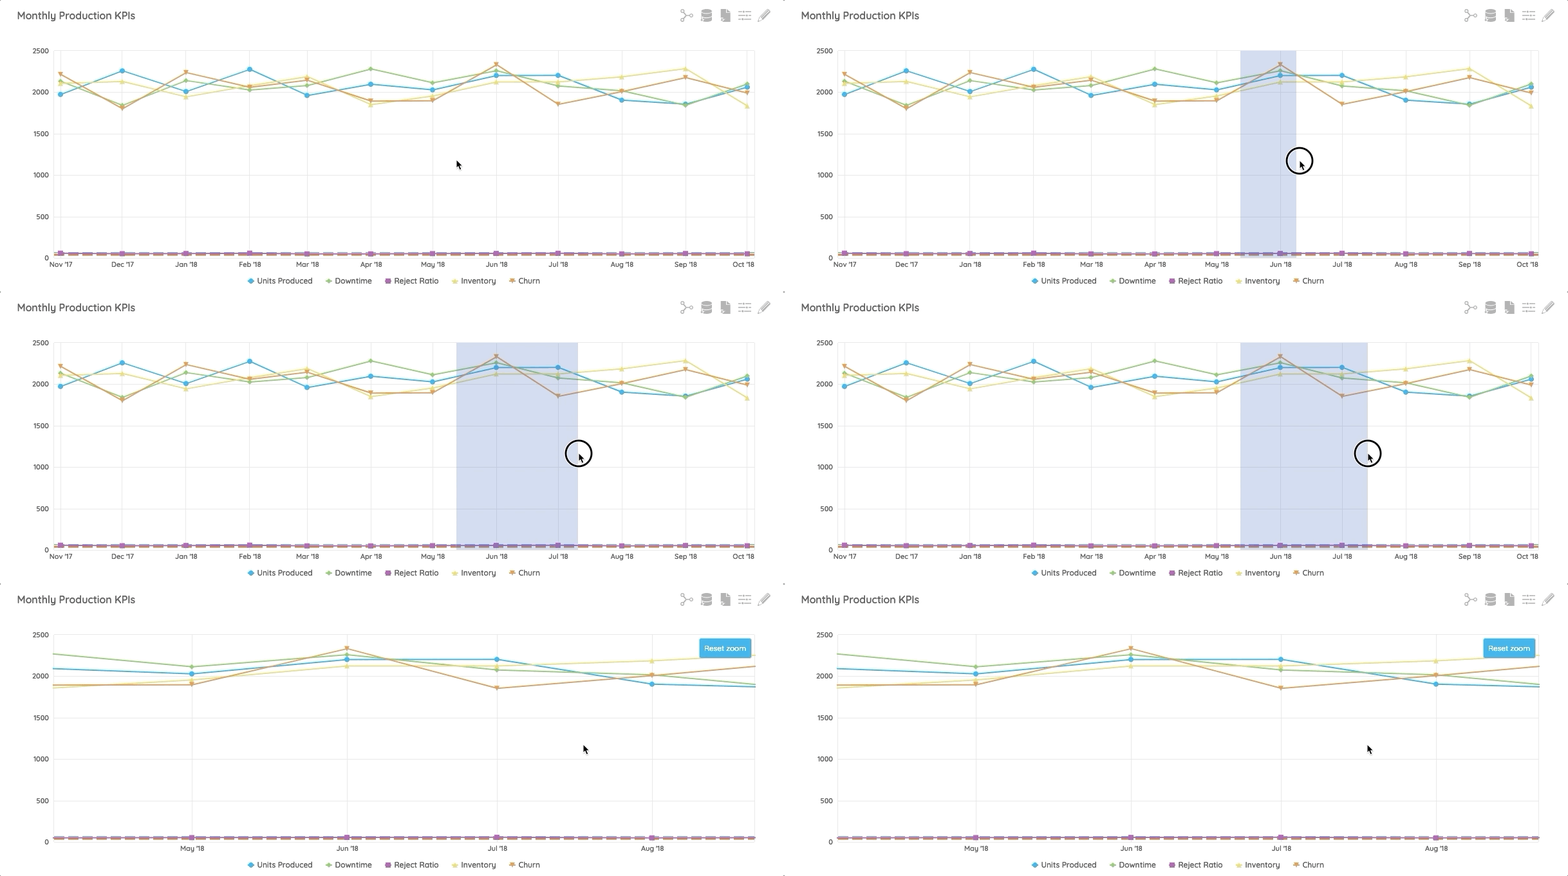
Our latest Watershed feature updates include the ability to zoom in on line charts, improvements to search results, and the ability to hide measures from heatmaps.
Line Report Zoom
When using line reports, zoom into important data ranges by simply selecting the area you’d like to expand.

Any user can use this feature, even if they don’t have access to the report builder. Zooming will not change the report’s configuration, so it won’t affect the report for any other user.
Recommended Reading
Updated Search Results
We’ve updated our search functionality to better display large numbers of results, making it even easier to quickly find the information you need.
If you search for a term that has more than 10 results, you’ll now see a modal that’s alphabetized and organized by group. This is ideal for organizations with large numbers of people and groups when configuring reports.
Recommended Reading in Watershed
Hiding Data from Heatmaps
Last year, we introduced the ability to perform calculations between measures so you can create reports that present data such as sales per person or average score.
And, until recently, every measure that was involved in measure calculations would be included in the heatmap report. Now, you can hide measures that aren’t intended to be shown on a report.
Recommended Reading
About the author
Brooks Alford is a tenured client success and operations leader who helps companies make innovative and complex technology accessible to all.
Subscribe to our blog